

Originally published on the Metal Blog
In this tutorial, we will demonstrate the simplicity of clustering unstructured data with Metal.
We will use the Disneyland Reviews dataset to showcase the process of identifying distinct clusters in our data. By following along in a Jupyter Notebook environment, you'll be able to replicate each step seamlessly.
By the end of this tutorial, you will gain a clear understanding of how to leverage Metal's capabilities for clustering unstructured data, empowering you to apply these techniques to your own projects.
Let's get started.
Prerequisites:
To complete this tutorial, you should have the following installed:
Python 3.x
Pandas
Metal Python SDK library (instructions provided in the tutorial)
Step 1: Set up an Account and Create an Index 🔥
Let's kick off by setting up your Metal account and creating an Index in the Metal app. Here's how:
Head over to app.getmetal.io and sign up for an account.
Once you're logged in, select a name for your Index that represents your project or dataset.
Choose the Open AI ADA embedding Model. This will help us in clustering our data effectively.
Click on "Create Index" and bam! Your Index is ready to rock!
Step 2: Install Metal's Python SDK
Next, let's get the Metal Python library up and running. Simply open a new terminal or command prompt and enter:
pip3 install metal-sdk
Step 3: Import Libraries and Connect to the Metal API
Open a new file on the code editor of your choice and create a new notebook or Python file. Start by importing the necessary libraries and initializing Metal:
import pandas as pd
from metal_sdk.metal import Metal

index_id = 'INDEX_ID'
api_key = 'METAL_API_KEY'
client_id = 'CLIENT_ID'

metal = Metal(api_key, client_id, index_id)
Replace 'INDEX_ID', 'METAL_API_KEY', and 'CLIENT_ID' with your actual values. You can find the Index ID in the Settings tab of your newly created Index.
Step 4: Load the Dataset
Now, it's time to load the dataset. Make sure the file is present in your project directory. Note this dataset uses Latin-1 encoding, so we'll specify the encoding parameter as 'latin-1' when reading the file.
data = pd.read_csv("DisneylandReviews.csv", encoding='latin-1')
df = data[data['Branch'] == 'Disneyland_California'].sample(1000)
For this example, we'll work with a random sample of 1000 records from the Disneyland California branch. Running df.head() will display a preview of the dataset, with the "Review_Text" column containing the reviews we will index.
| Review_ID | Rating | Year_Month | Reviewer_Location | Review_Text | Branch | |
| 19794 | 256655025 | 5 | 2015-2 | United Kingdom | Having been to WDW Florida 6 times we wanted t... | Disneyland_California |
| 18431 | 289368662 | 5 | 2015-1 | Argentina | We stayed there in motorhome on our way back f... | Disneyland_California |
| 28205 | 118678599 | 5 | 2011-9 | Australia | I would strongly recommend Lux Bus america for... | Disneyland_California |
| 22946 | 186941816 | 5 | 2013-11 | Finland | Wow we had a great three days at Disneyland Pa... | Disneyland_California |
| 9895 | 648604900 | 2 | 2018-2 | United States | I am a Southern California grandmother who rem... | Disneyland_California |
Step 5: Prepare and Index the Data
Great! Now that we have our data loaded, it's time to index or push it into our system. To index in bulk, we need to follow a specific format:
metal.index_many([{ "text": "We had a great and fun time visiting Disneyland", "index": "index-id" }, { "text": "Early September is a good time to go", "index": "index-id" }])
To make it easier, we can create a list of dictionaries by iterating over our data frame like this:
payload = [{"text": review, "index": index_id} for review in df['Review_Text']]
However, note that the platform allows indexing data in chunks of 100 records at a time. So, if you're dealing with large datasets, it's wise to break them into smaller parts and then combine them. We can use the following function for that:
def index_many_in_chunks(df):
    number_of_chunks = len(df) // 100
    for i in range(number_of_chunks):
        start_index = i * 100
        end_index = (i + 1)*100
        payload = [{"text": review, "index": index_id} for review in df['Review_Text'][start_index:end_index]]
        metal.index_many(payload)

index_many_in_chunks(sample_df)
To get things rolling, simply hit that "Run" button for all the cells or run the Python file, and everything should work smoothly. Here is the source code for reference.
Step 6: Perform Clustering
Now that the data has been successfully indexed, we are ready to cluster our data. To initiate the clustering process, follow these steps:
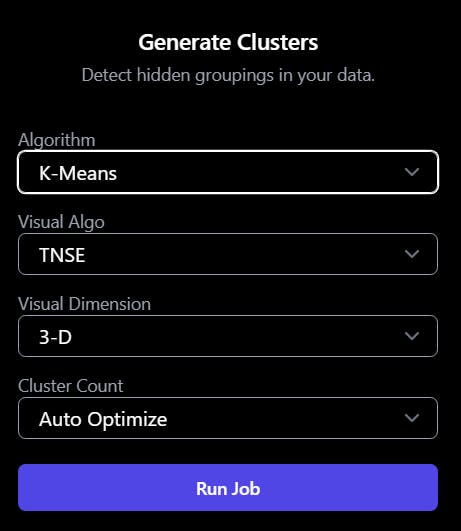
Access the web app and navigate to the Clustering tab.
Choose the K-means algorithm
Specify the desired number of clusters you want to create based on your analysis goals. If needed, you can also use the auto-optimize tool to determine the optimal number of clusters automatically.
Select the appropriate visualization algorithm and dimension that best suits your requirements. This step helps in visualizing and interpreting the clustering results effectively.
Start the clustering process, allowing the algorithm to analyze and group the data based on similarities or patterns.
Step 7: Evaluate Results
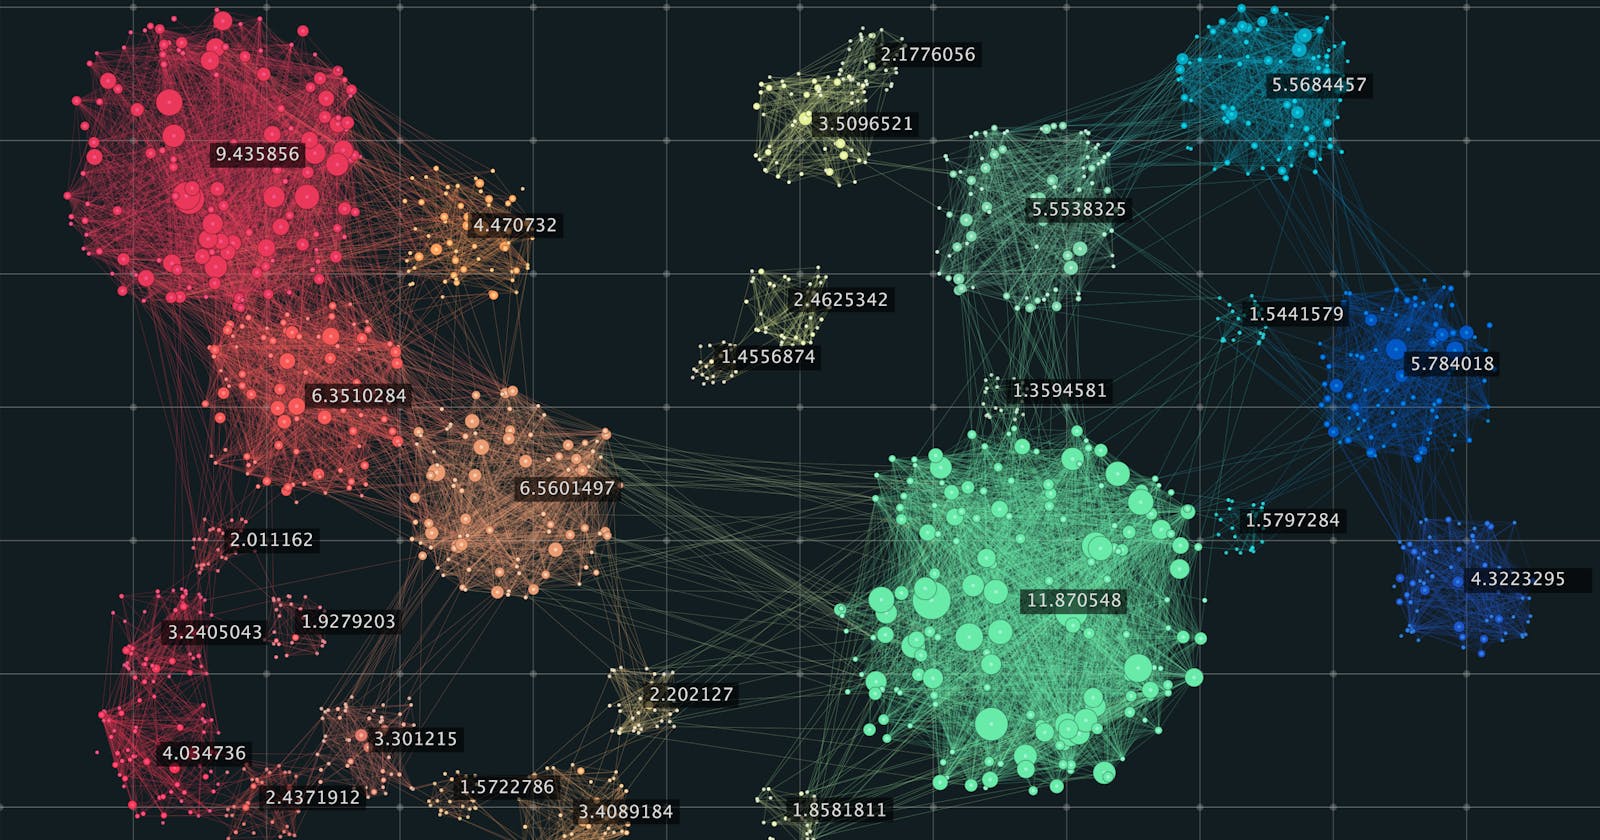
Congratulations! We can now view our data separated into meaningful clusters. How cool is that?
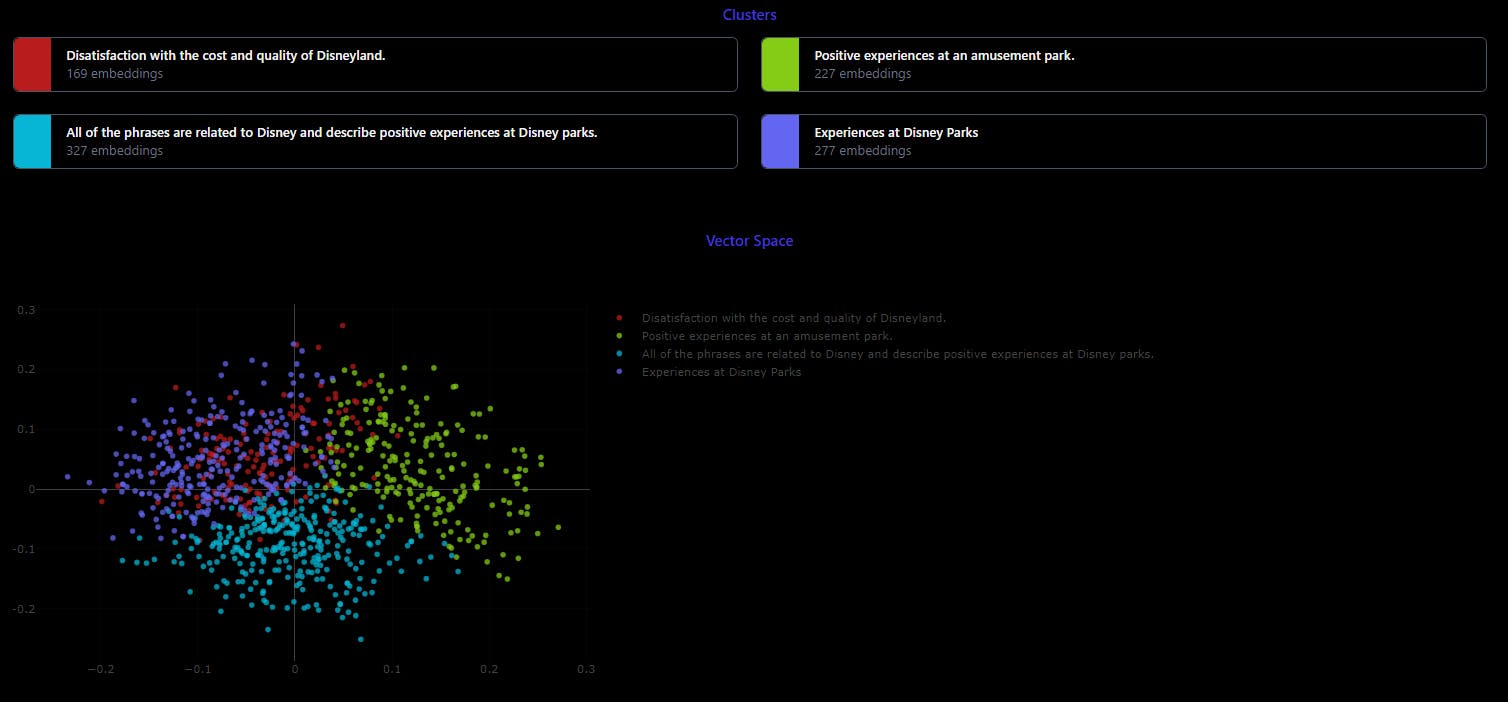
Take a look at the results and explore the insights gained from the clustering. Consider using visualization algorithms like PCA, t-SNE, or UMAP based on the nature of your data and your visualization goals.
As a guide, here are some recommendations for choosing visualization algorithms:
PCA: Use it when you need to reduce dimensionality while preserving overall structure and variability in linear data.
t-SNE: Ideal for visualizing local relationships and clusters in smaller datasets with non-linear and complex data.
UMAP: Suitable for scalable visualization and analysis of high-dimensional data, especially in larger datasets.
Remember to take into account the nature of your data (linear or non-linear), your visualization goals, and the size of your dataset when selecting the most appropriate technique.
Last but not least, don't be afraid to experiment and evaluate the quality of the results to determine the technique that best suits your specific dataset and objectives.